Generate Spectrograms Online with Free Audio Analysis Tool
Our free online spectrogram generator offers a powerful way to visualize and analyze sound patterns in real-time. Whether you're a sound engineer, musician, or researcher, our online tool provides professional-grade spectrogram generation capabilities accessible from any device.
Start Analyzing SoundInteractive Spectrogram Generator
Why Use Our Free Spectrogram Generator?
Generate High-Quality Spectrograms Instantly
Create professional-grade spectrograms in real-time with instant visual feedback. No waiting, no rendering delays.
Compare Different Sound Patterns Side by Side
Analyze and compare multiple audio sources to understand frequency differences and sound characteristics visually.
Record Live Audio Using Your Microphone
Capture and analyze audio in real-time using your device's microphone. Perfect for live sound analysis and demonstrations.
Upload and Analyze Audio Files
Import your audio files for detailed frequency analysis. Supports various audio formats for comprehensive sound visualization.
Export Spectrograms for Further Analysis
Save your spectrograms for documentation, presentations, or deeper analysis in other audio processing tools.
Professional-Grade Analysis Tool
Gain insights into frequency content, harmonics, and sound structure with industry-standard visualization techniques.
About Our Free Spectrogram Generator
Our free online spectrogram generator transforms audio analysis into an accessible and intuitive experience. Whether you're analyzing music, speech, or environmental sounds, our tool provides professional-grade frequency visualization that helps you understand the hidden structure of sound.
What You Can Do:
- ✓Generate high-quality spectrograms instantly - Visualize frequency content in real-time with professional accuracy
- ✓Compare different sound patterns side by side - Understand frequency differences between multiple audio sources
- ✓Record live audio using your microphone - Capture and analyze sounds in real-time from your environment
- ✓Upload and analyze audio files - Import recordings for detailed frequency analysis and visualization
- ✓Export spectrograms for further analysis - Save visualizations for documentation and deeper study
- ✓No installation required - Use directly in your browser without downloads or complex setup
Perfect For:
A spectrogram is a visual representation of how sound frequencies change over time. It's like a fingerprint of audio, revealing patterns, harmonics, and characteristics that are invisible to the naked ear. Our tool makes this professional analysis technique accessible to everyone.
Start Visualizing Sound Today - Completely Free!
No registration required, no hidden costs. Unlock the hidden world of sound frequencies and discover what your ears can't see.
Spectrogram Generator Frequently Asked Questions
A spectrogram is a visual representation of sound that shows how frequencies change over time. This free spectrogram generator transforms audio into a visual graph where the horizontal axis represents time, the vertical axis represents frequency (pitch), and colors or brightness represent amplitude (volume). When you use this spectrogram tool, you can literally 'see' sound - watching how different frequencies appear and change throughout a recording. This online spectrogram makes the invisible structure of audio visible, revealing patterns, harmonics, and characteristics that your ears alone might miss. It's like an X-ray for sound!
Spectrogram generators are used across many fields! Audio engineers use this spectrogram tool to identify and fix problems in recordings - finding unwanted noise, resonances, or frequency masking issues. Musicians and producers use the spectrogram generator to analyze the frequency content of instruments and mixes. Speech and language researchers use spectrograms to study phonetics and pronunciation patterns. Biologists analyze animal vocalizations with spectrogram tools. Music teachers use this free spectrogram to demonstrate acoustics concepts visually. Even forensic investigators use spectrograms for audio authentication. This versatile online spectrogram tool serves anyone who needs to understand the frequency structure of sound.
Yes! This free spectrogram tool supports analyzing your own audio. You can use your device's microphone to generate spectrograms in real-time - perfect for analyzing live sounds, singing, instruments, or environmental noises. Many spectrogram generators also allow you to upload audio files for detailed analysis. This online spectrogram lets you examine recordings to understand their frequency content, identify problematic frequencies, compare different versions of a mix, or study how different instruments contribute to a song's overall spectrum. It's an invaluable tool for audio production and analysis.
Reading a spectrogram becomes intuitive with practice! In this spectrogram generator, time flows from left to right (like normal audio playback). The vertical position shows frequency - lower frequencies (bass) at the bottom, higher frequencies (treble) at the top. The color or brightness indicates amplitude (volume) - typically, brighter colors or warmer colors (red/yellow) show louder frequencies, while darker colors or cooler colors (blue/black) show quieter ones. When you see a horizontal line on the spectrogram, that's a sustained note. Vertical patterns show transients or percussive sounds. Harmonic overtones appear as parallel horizontal lines. This free spectrogram tool helps you visualize these patterns clearly.
Absolutely! This free spectrogram tool is invaluable for audio production. A spectrogram generator helps you identify frequency conflicts where multiple instruments compete in the same frequency range, making mixes muddy. You can use this spectrogram to spot unwanted resonances, room noise, or electrical interference that might not be immediately obvious to your ears. The online spectrogram reveals if your mix has adequate bass content, balanced midrange, and appropriate high-frequency detail. Professional audio engineers regularly use spectrograms alongside their ears to make informed mixing and mastering decisions. This visualization helps you understand what you're hearing and make better technical and creative choices.
Extremely well-suited! This free spectrogram generator is an exceptional educational tool for teaching acoustics, audio engineering, music technology, and physics. Students can use this spectrogram to visualize abstract concepts like frequency, amplitude, harmonics, overtones, and timbre. Teachers use this online spectrogram to demonstrate why different instruments sound different (they show different harmonic patterns), how vowel sounds differ (different formant patterns), and how sound waves actually work. The real-time nature of this spectrogram tool makes learning interactive - students can experiment with their voices or instruments and immediately see the results. It transforms acoustic theory from abstract numbers into concrete, visible patterns.
Great question! A waveform shows amplitude (volume) over time but doesn't reveal frequency information. A spectrogram shows frequency content over time - revealing the 'color' or 'texture' of sound, not just its volume. While waveforms are useful for timing and basic editing, this spectrogram generator provides much deeper insight into what makes sounds unique. Two sounds might look similar on a waveform but show dramatically different patterns on a spectrogram. For example, a flute and a violin playing the same note show similar waveforms but distinct spectrograms because their harmonic content differs. This free spectrogram tool helps you understand the frequency makeup of sounds, making it essential for audio analysis, sound design, and understanding acoustics. Use waveforms for basic editing, but turn to this online spectrogram for detailed frequency analysis.
Explore More Music Creation Tools
Discover our complete suite of free music creation tools, each offering a unique creative experience
Song Maker
Create complete songs combining melodies and rhythms to bring your musical ideas to life
SongMaker Plus
Access studio-ready sounds and browser-based mixing to craft professional songs for free
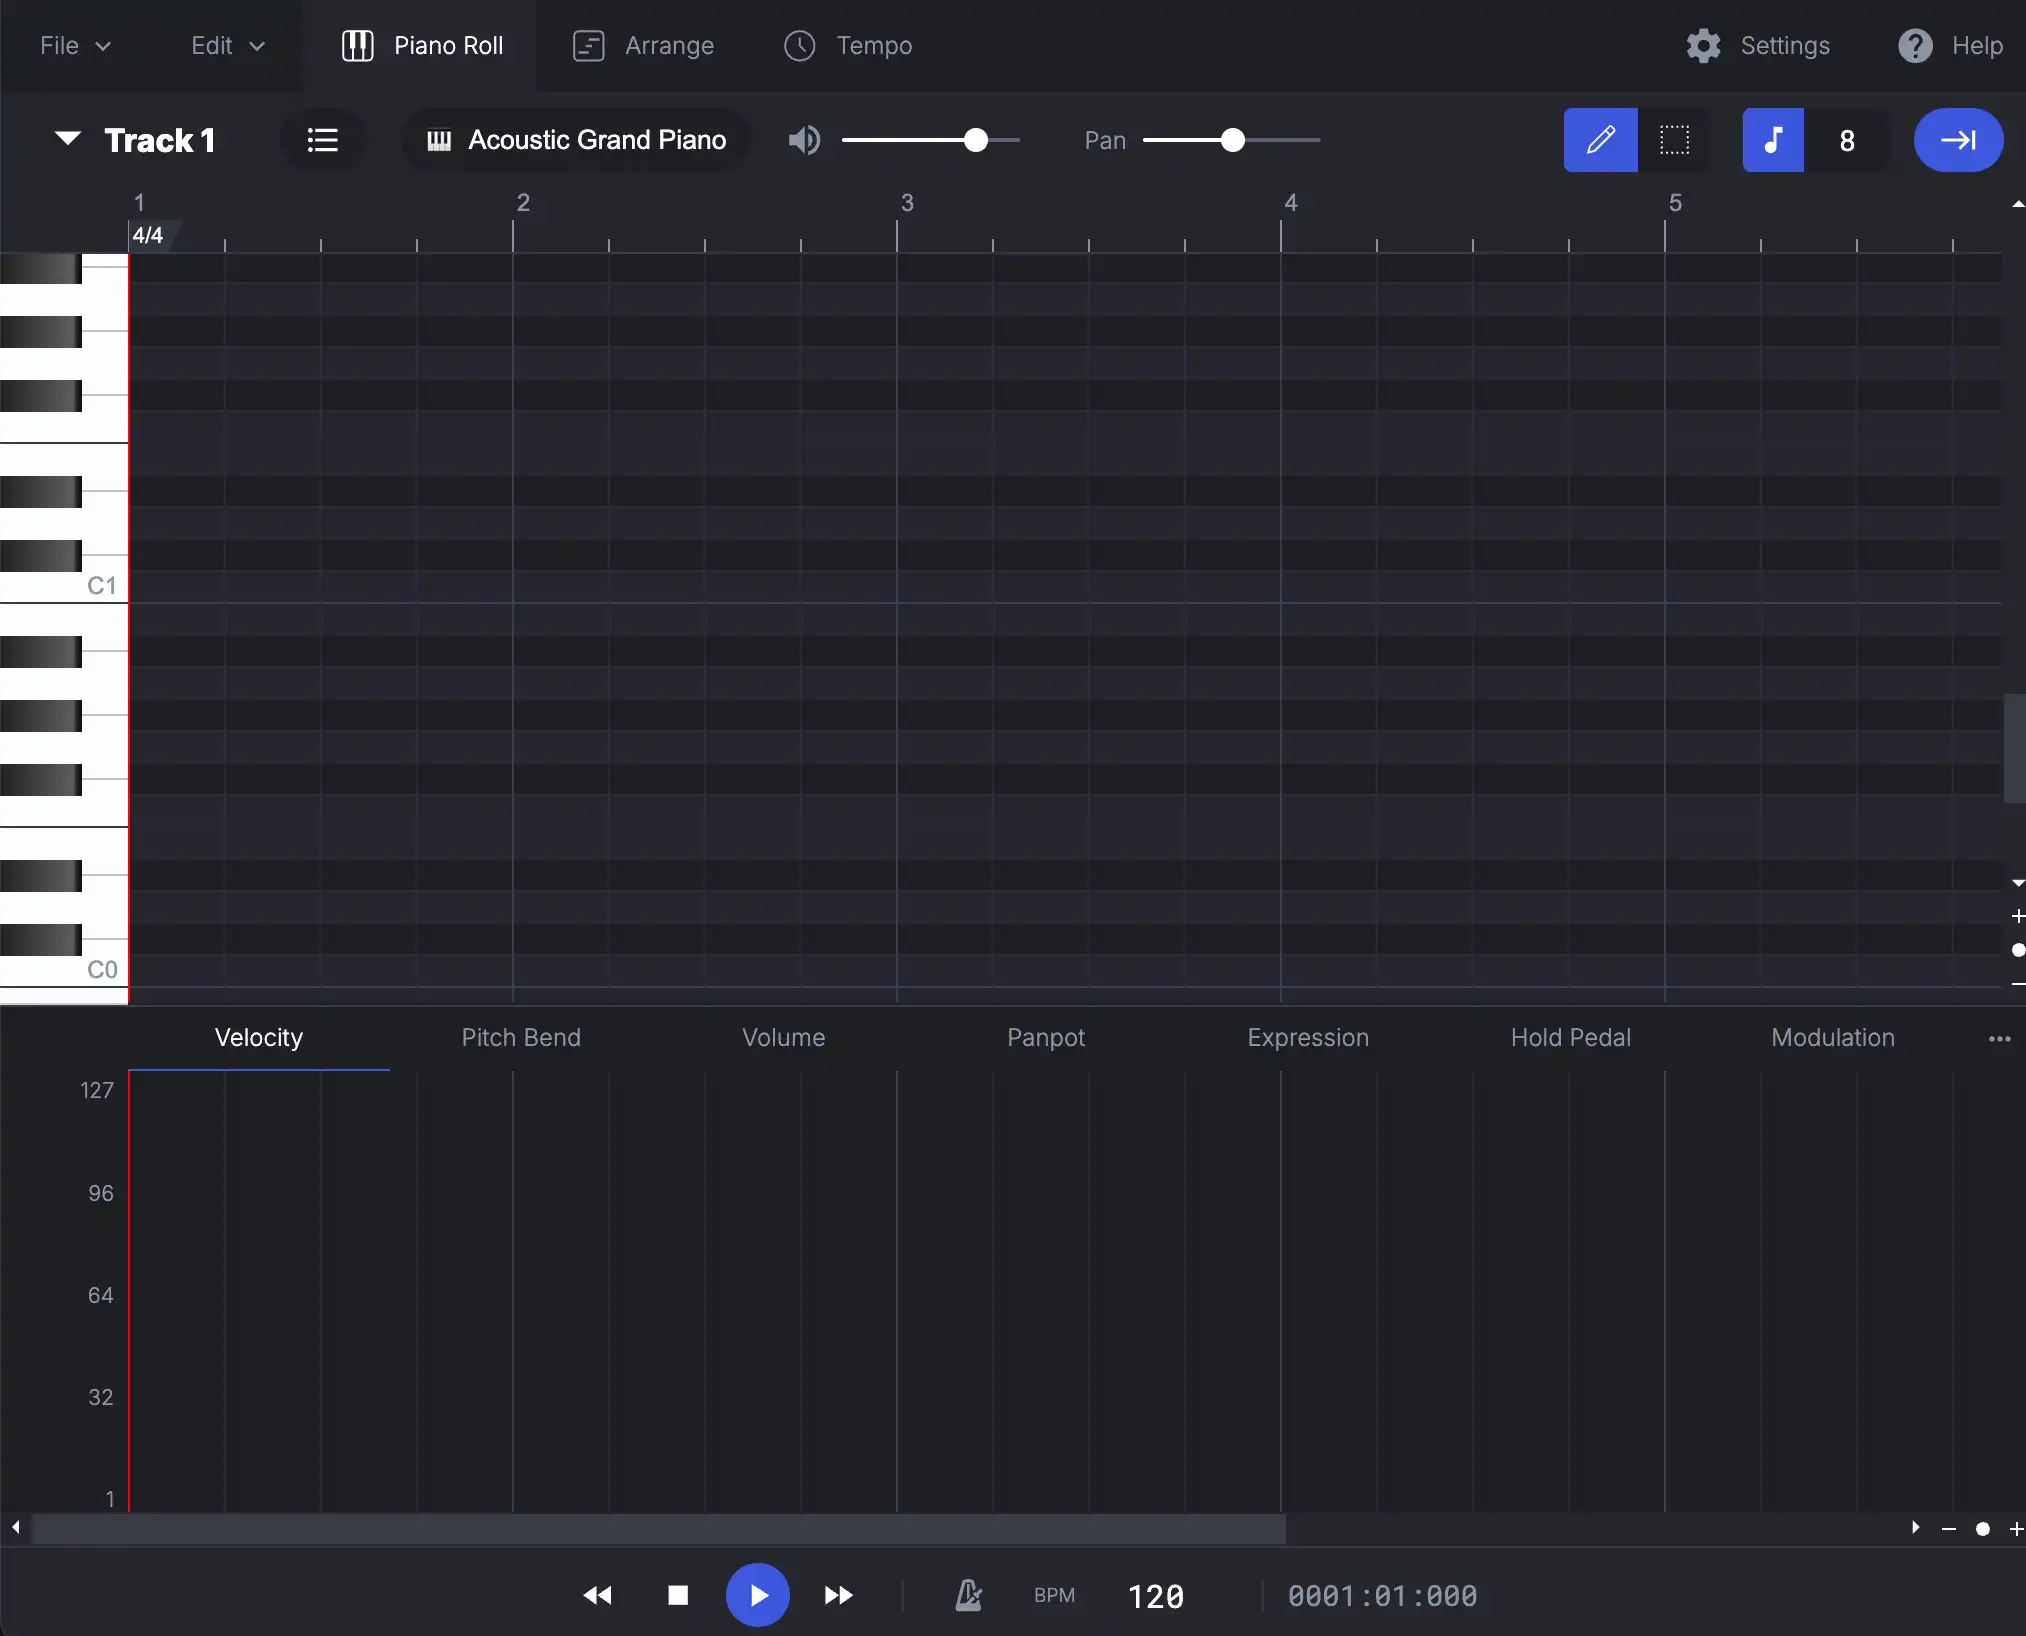
MIDI Editor
Work in a fullscreen piano roll, arrange MIDI clips faster, and stay in the browser while composing
Rhythm Maker
Explore the power of rhythm and create professional beats and drum patterns
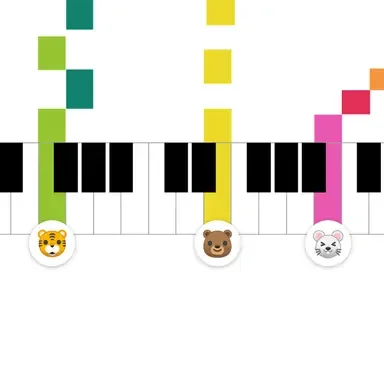
Melody Maker
Compose beautiful melodies through visual grids and turn patterns into music
Shared Piano
Collaborate in real-time with musicians worldwide and play piano together

Kandinsky
Transform music into visual art and experience synaesthesia with real-time sound visualization

BPM Tapper
Tap tempo instantly, view stability scores, and learn musical tempo markings without leaving your browser
Ready to Analyze Sound Patterns?
Join professionals and enthusiasts worldwide using our free spectrogram generator to visualize and understand sound.